Group By Reports
General use case
Group by reports are reports that group the data by a specific field, while doing some kind of calculation on the grouped fields. For example, a report that groups the expenses by the expense type.
Example:
class GroupByReport(ReportView):
    report_model = SalesTransaction
    report_title = _("Group By Report")
    date_field = "date"
    group_by = "product"

    columns = [
        "name",
        ComputationField.create(
            method=Sum,
            field="value",
            name="value__sum",
            verbose_name="Total sold $",
            is_summable=True,
        ),
    ]

    # Charts
    chart_settings = [
        Chart(
            "Total sold $",
            Chart.BAR,
            data_source=["value__sum"],
            title_source=["name"],
        ),
    ]
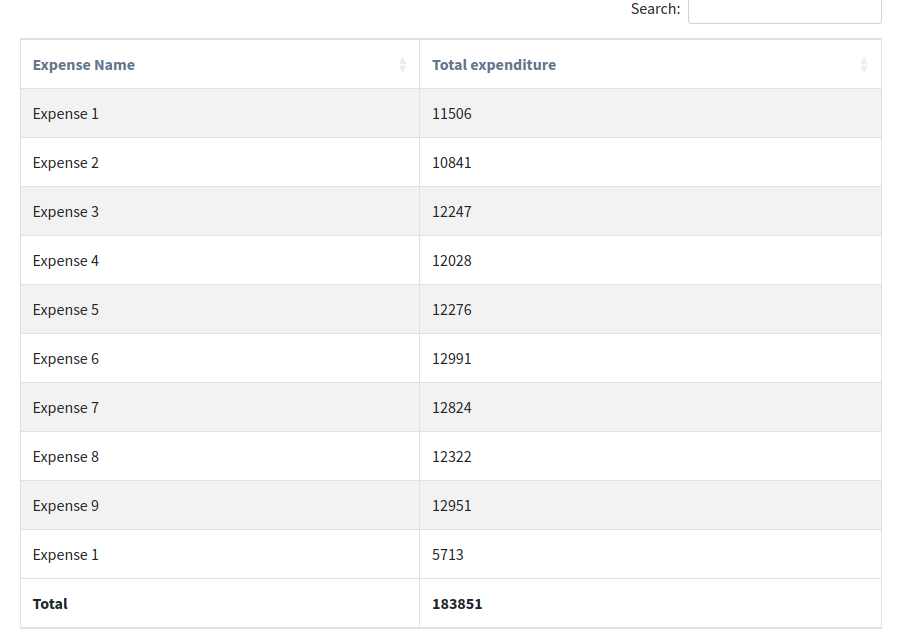
A Sample group by report would look like this:

In the columns you can access to fields on the model that is being grouped by, in this case the Expense model, and the computation fields.
Group by a traversing field
group_byvalue can be a traversing field. If set, the report will be grouped by the last field in the traversing path,and, the columns available will be those of the last model in the traversing path.
Example:
# Inherit from previous report and make another version, keeping the columns and charts
class GroupByTraversingFieldReport(GroupByReport):

    report_title = _("Group By Traversing Field")
    group_by = "product__product_category"  # Note the traversing
Group by custom querysets
Grouping can also be over a curated queryset(s).
Example:
class GroupByCustomQueryset(ReportView):
    report_model = SalesTransaction
    report_title = _("Group By Custom Queryset")
    date_field = "date"

    group_by_custom_querysets = [
        SalesTransaction.objects.filter(product__size__in=["big", "extra_big"]),
        SalesTransaction.objects.filter(product__size__in=["small", "extra_small"]),
        SalesTransaction.objects.filter(product__size="medium"),
    ]
    group_by_custom_querysets_column_verbose_name = _("Product Size")

    columns = [
        "__index__",
        ComputationField.create(
            Sum, "value", verbose_name=_("Total Sold $"), name="value"
        ),
    ]

    chart_settings = [
        Chart(
            title="Total sold By Size $",
            type=Chart.PIE,
            data_source=["value"],
            title_source=["__index__"],
        ),
        Chart(
            title="Total sold By Size $",
            type=Chart.BAR,
            data_source=["value"],
            title_source=["__index__"],
        ),
    ]

    def format_row(self, row_obj):
        # Put the verbose names we need instead of the integer index
        index = row_obj["__index__"]
        if index == 0:
            row_obj["__index__"] = "Big"
        elif index == 1:
            row_obj["__index__"] = "Small"
        elif index == 2:
            row_obj["__index__"] = "Medium"
        return row_obj
This report will create two groups, one for pending sales and another for paid and overdue together.
The __index__ column is a “magic” column, it will added automatically to the report if it’s not added.
It just hold the index of the row in the group.
its verbose name (ie the one on the table header) can be customized via group_by_custom_querysets_column_verbose_name
You can then customize the value of the __index__ column via format_row hook
The No Group By
Sometimes you want to get some calculations done on the whole report_model, without a group_by. You can do that by having the calculation fields you need in the columns, and leave out the group by.
Example:
class NoGroupByReport(ReportView):
    report_model = SalesTransaction
    report_title = _("No-Group-By Report [WIP]")
    date_field = "date"
    group_by = ""

    columns = [
        ComputationField.create(
            method=Sum,
            field="value",
            name="value__sum",
            verbose_name="Total sold $",
            is_summable=True,
        ),
    ]
This report will give one number, the sum of all the values in the value field of the SalesTransaction model, within a period.