Django Slick Reporting#
The one-stop reporting engine for Django — analytics, charts & dashboards in a few lines of code.


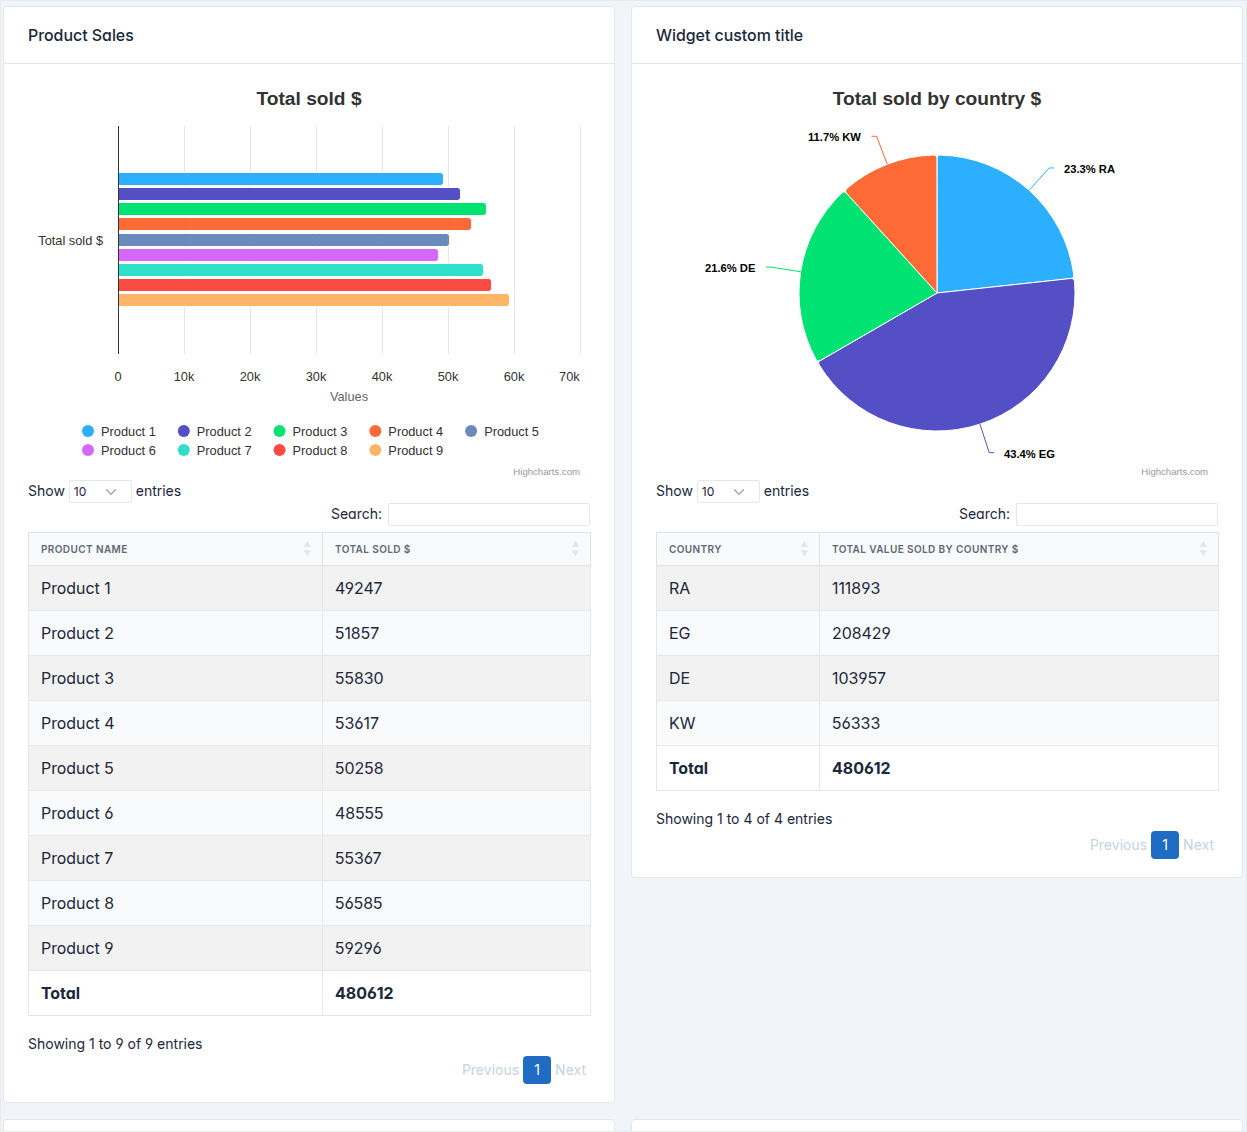
Grouped totals, time-series, crosstabs and pivots — each one a small Python class, each one chartable with a single line, in Highcharts, Chart.js or ApexCharts.
Why Django Slick Reporting?#
Simple aggregates, group-by, time-series, crosstab/pivot, and any combination of them, in a handful of lines.
Highcharts, Chart.js and ApexCharts wrappers — bar, column, line, area, pie, stacked or totalled.
Build reusable computation fields, chain dependencies, compute percentages and balances.
Drop any report onto a page as a self-contained widget with a single template tag.
Report against a Django model, a traversed relation, a raw SQL table, or precomputed/aggregated data.
Optimized queries, CSV export out of the box, and hooks for everything.
Installation#
To install django-slick-reporting with pip
pip install django-slick-reporting
Usage#
Add
"slick_reporting", "crispy_forms", "crispy_bootstrap4",toINSTALLED_APPS.Add
CRISPY_TEMPLATE_PACK = "bootstrap4"to yoursettings.pyExecute
python manage.py collectstaticso the JS helpers are collected and served.
Quickstart#
You can start by using ReportView which is a subclass of django.views.generic.FormView
# in views.py
from slick_reporting.views import ReportView, Chart
from slick_reporting.fields import ComputationField
from .models import MySalesItems
from django.db.models import Sum


class ProductSales(ReportView):

    report_model = MySalesItems
    date_field = "date_placed"
    group_by = "product"

    columns = [
        "title",
        ComputationField.create(
            method=Sum, field="value", name="value__sum", verbose_name="Total sold $"
        ),
    ]

    # Charts
    chart_settings = [
        Chart(
            "Total sold $",
            Chart.BAR,
            data_source=["value__sum"],
            title_source=["title"],
        ),
    ]


# in urls.py
from django.urls import path
from .views import ProductSales

urlpatterns = [
    path("product-sales/", ProductSales.as_view(), name="product-sales"),
]
That’s the whole report — filter form, chart, sortable data table and CSV export are generated for you.
Demo site#
django-slick-reporting.com is a quick walk-though with live code examples.